Acoustic measurement · Android · Built for our own bench
Room and speaker measurement, on Android.
RT60, Wiener deconvolution, multi-angle dispersion. A Farina log sweep, a
sync-pulsed timeline, an honest impulse response. The Android apps we built
for our own workshop bench — now on Google Play.
Two Android apps. One DSP core. Built for our own bench, then shipped.
Two apps, one engine. Simple Sweep is the bench job most builders run — a
single speaker, a sweep, an FRD file. Stain Acoustics is the full suite, with
Simple Sweep baked in as a module alongside room analysis, multi-angle dispersion,
and the phone-mic calibration wizard.
Simple Sweep
$5.99
Single-speaker measurement, focused. For builders who want a sweep, a chart, and
an FRD file.
Single-speaker frequency response · RAW · 1/12 · 1/6 · 1/3 · 1/1 smoothing
Impulse response, sweep history, comparison overlay (up to 3)
No mystery, no marketing fog. Here's what happens between tap and chart.
If you read REW source comments for fun, this is the section you came for.
01
Generate 10 s Farina exponential sine sweep, 20 Hz to 20 kHz, equal energy per octave, with a 100 ms raised-fade-in to suppress the start-up transient.
02
Prepend a 1 kHz tone burst, 10 ms, −6 dBFS — the acoustic sync pulse. After recording, cross-correlation locates this pulse to sub-millisecond precision, eliminating variable Android, USB and Bluetooth playback latency from the timeline.
03
Play through AudioTrack (Java API, stereo-routable). Record on a single Oboe / C++ JNI stream with InputPreset::Unprocessed — AGC and noise suppression disabled. Verify the actual sample rate is 48 kHz, fail loud if not.
04
Wiener deconvolution in the frequency domain: H(f) = Y(f) · conj(X(f)) / (|X(f)|² + ε). The regulariser ε adapts to the measured noise floor — tightens when the room is quiet, relaxes when it isn't.
05
Truncate the impulse response adaptively against the IR-space noise floor. Compute timing metrics (Schroeder decay, RT60 via T20 with T30 fallback, EDT, C80, D50) on the uncalibrated IR — mic correction is applied to the magnitude array only, never to the IR.
06
Frequency response, phase (unwrapped), group delay, harmonic distortion (H2 / H3 / H5 from Farina pre-echo offsets). Magnitude smoothing at RAW, 1/12, 1/6, 1/3 and 1/1 octave. Bass extension reported as F3 / F6 / F10, scanned downward from 500 Hz — honestly returns NOT DETECTED when the response stays within target down to 20 Hz.
// calibration · USB mic *1000Hz header parsed for sensitivity (dBFS/Pa)
// phone-mic wizard · two back-to-back sweeps · 1/6-octave correction curve · sensitivity emitted as *1000Hz header so live SPL and FR chart agree
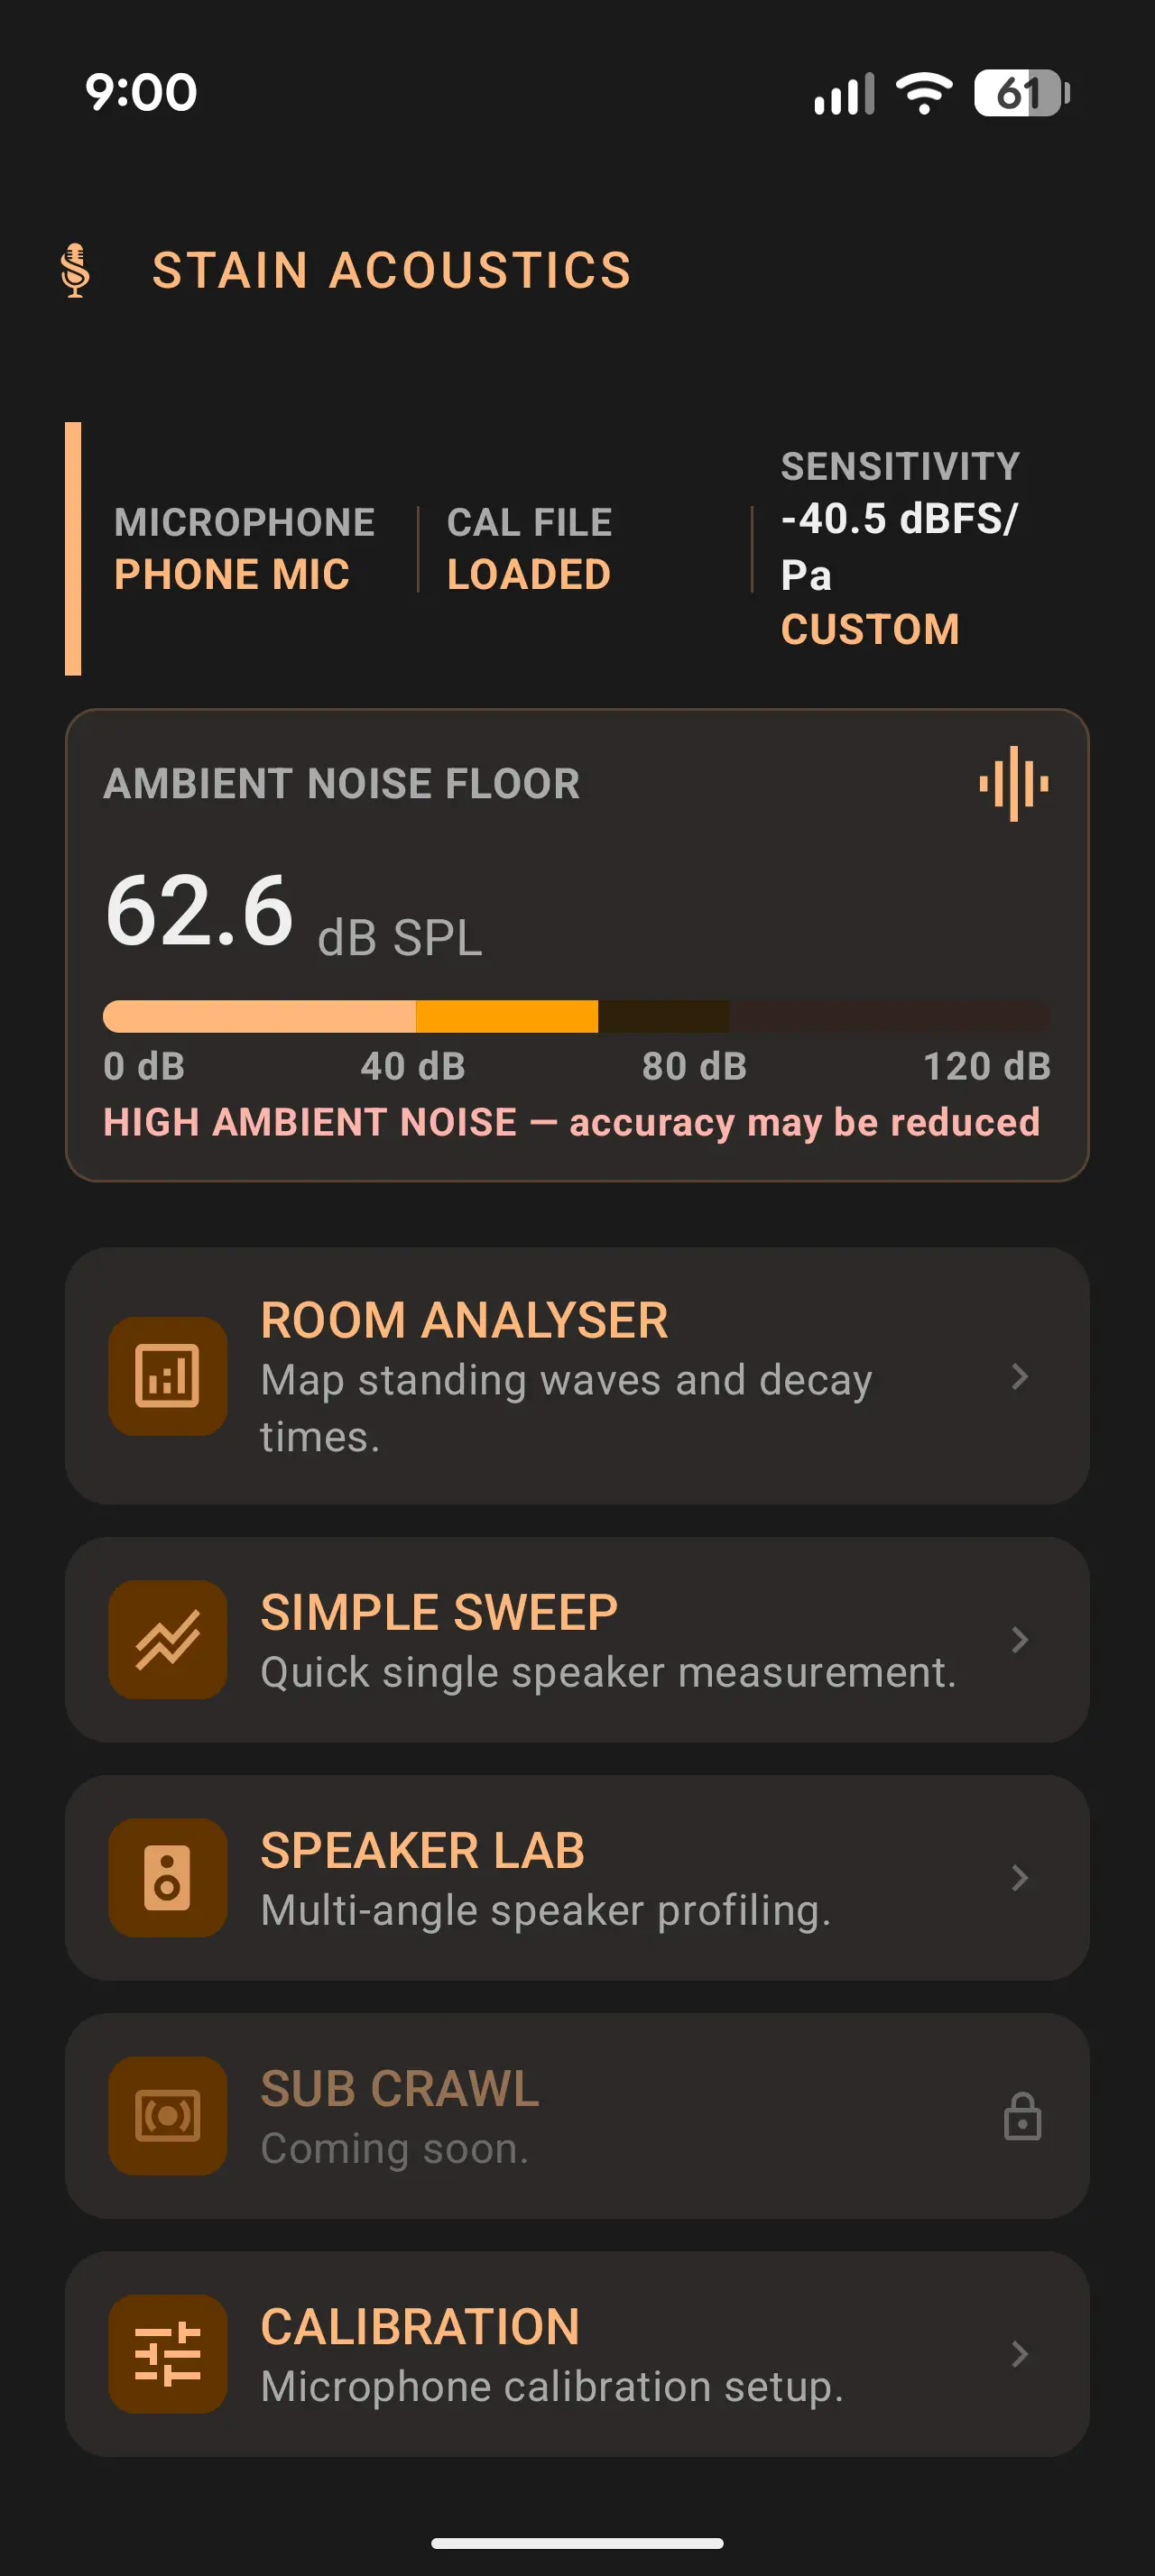
Features · What each measurement does
Five modules, one DSP core.
Every module rides the same Farina sweep + Wiener-deconvolution chain
with a different presentation on top. Here's what each one shows you
and what it's useful for.
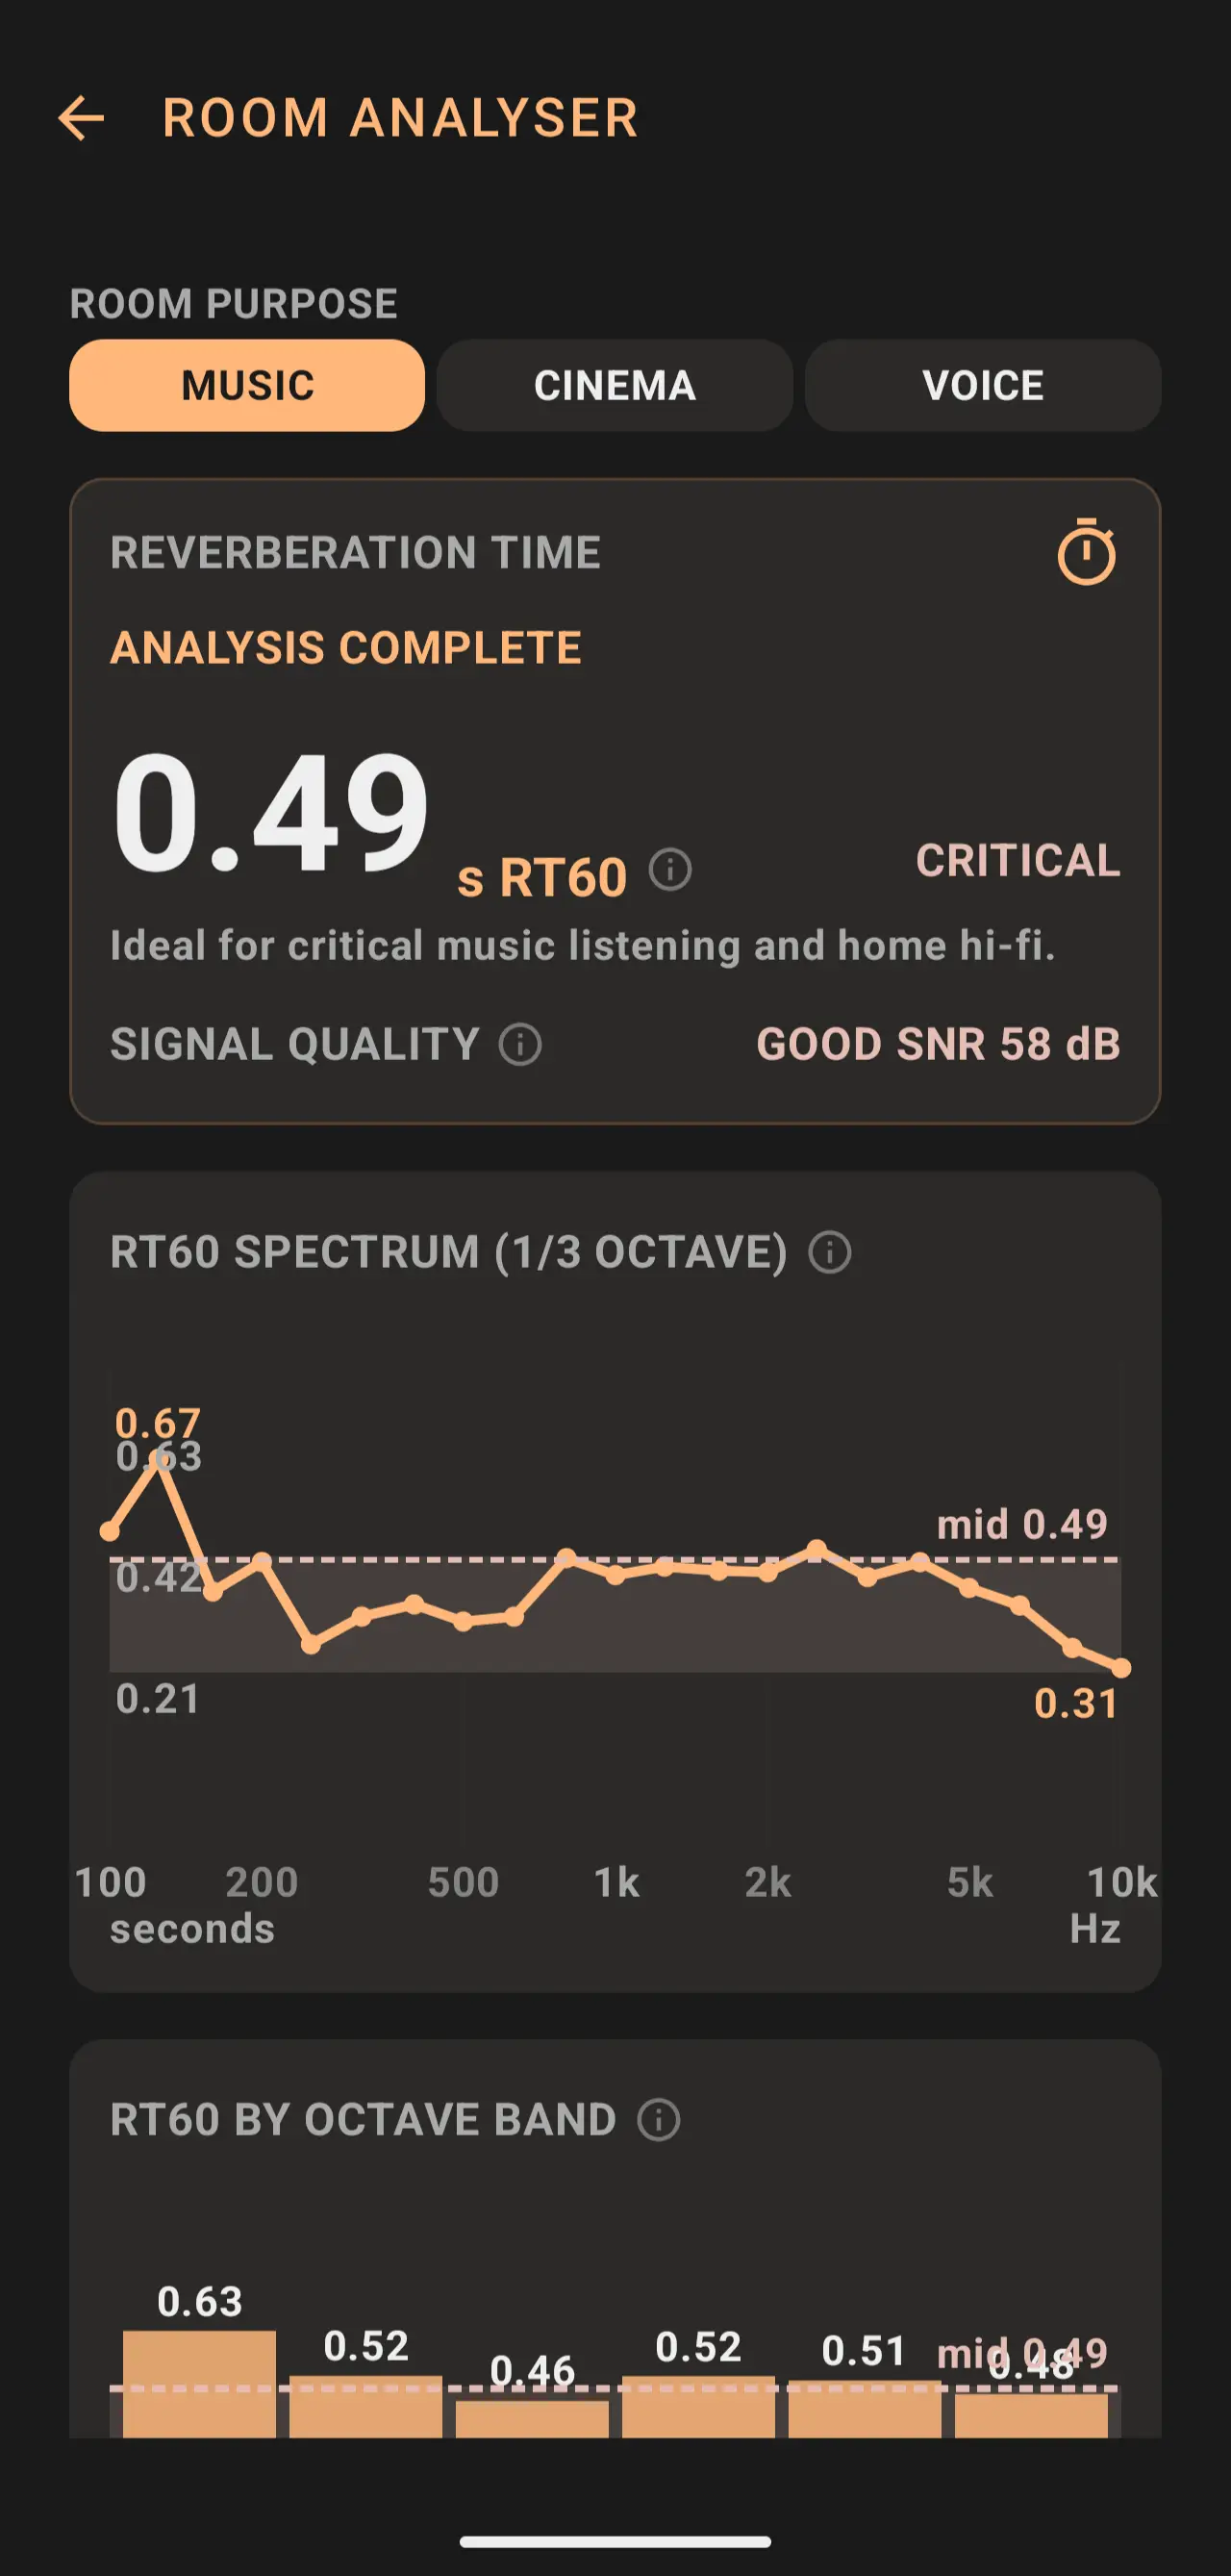
01 / Room Analyser
Measure the room your speakers will live in.
One Farina sweep, every room metric. RT60, EDT, D50, C80, signal-quality badge — plus a
1/3-octave RT60 spectrum and per-band decay bars, all derived from the same impulse response.
RT60 via T20 with T30 fallback, labelled against the chosen ROOM PURPOSE — music, cinema, voice.
Schroeder decay with the T20 window visible, C80 / D50 clarity numbers alongside.
Octave-band bars + 1/3-octave smoothed FR — the speech-intelligibility and bass-decay story at a glance.
Tap any chart for fullscreen; touch-and-drag pins an X / Y crosshair to the finger so axis values read off visually.
Export the calibrated IR as 24-bit mono WAV for downstream work in REW.
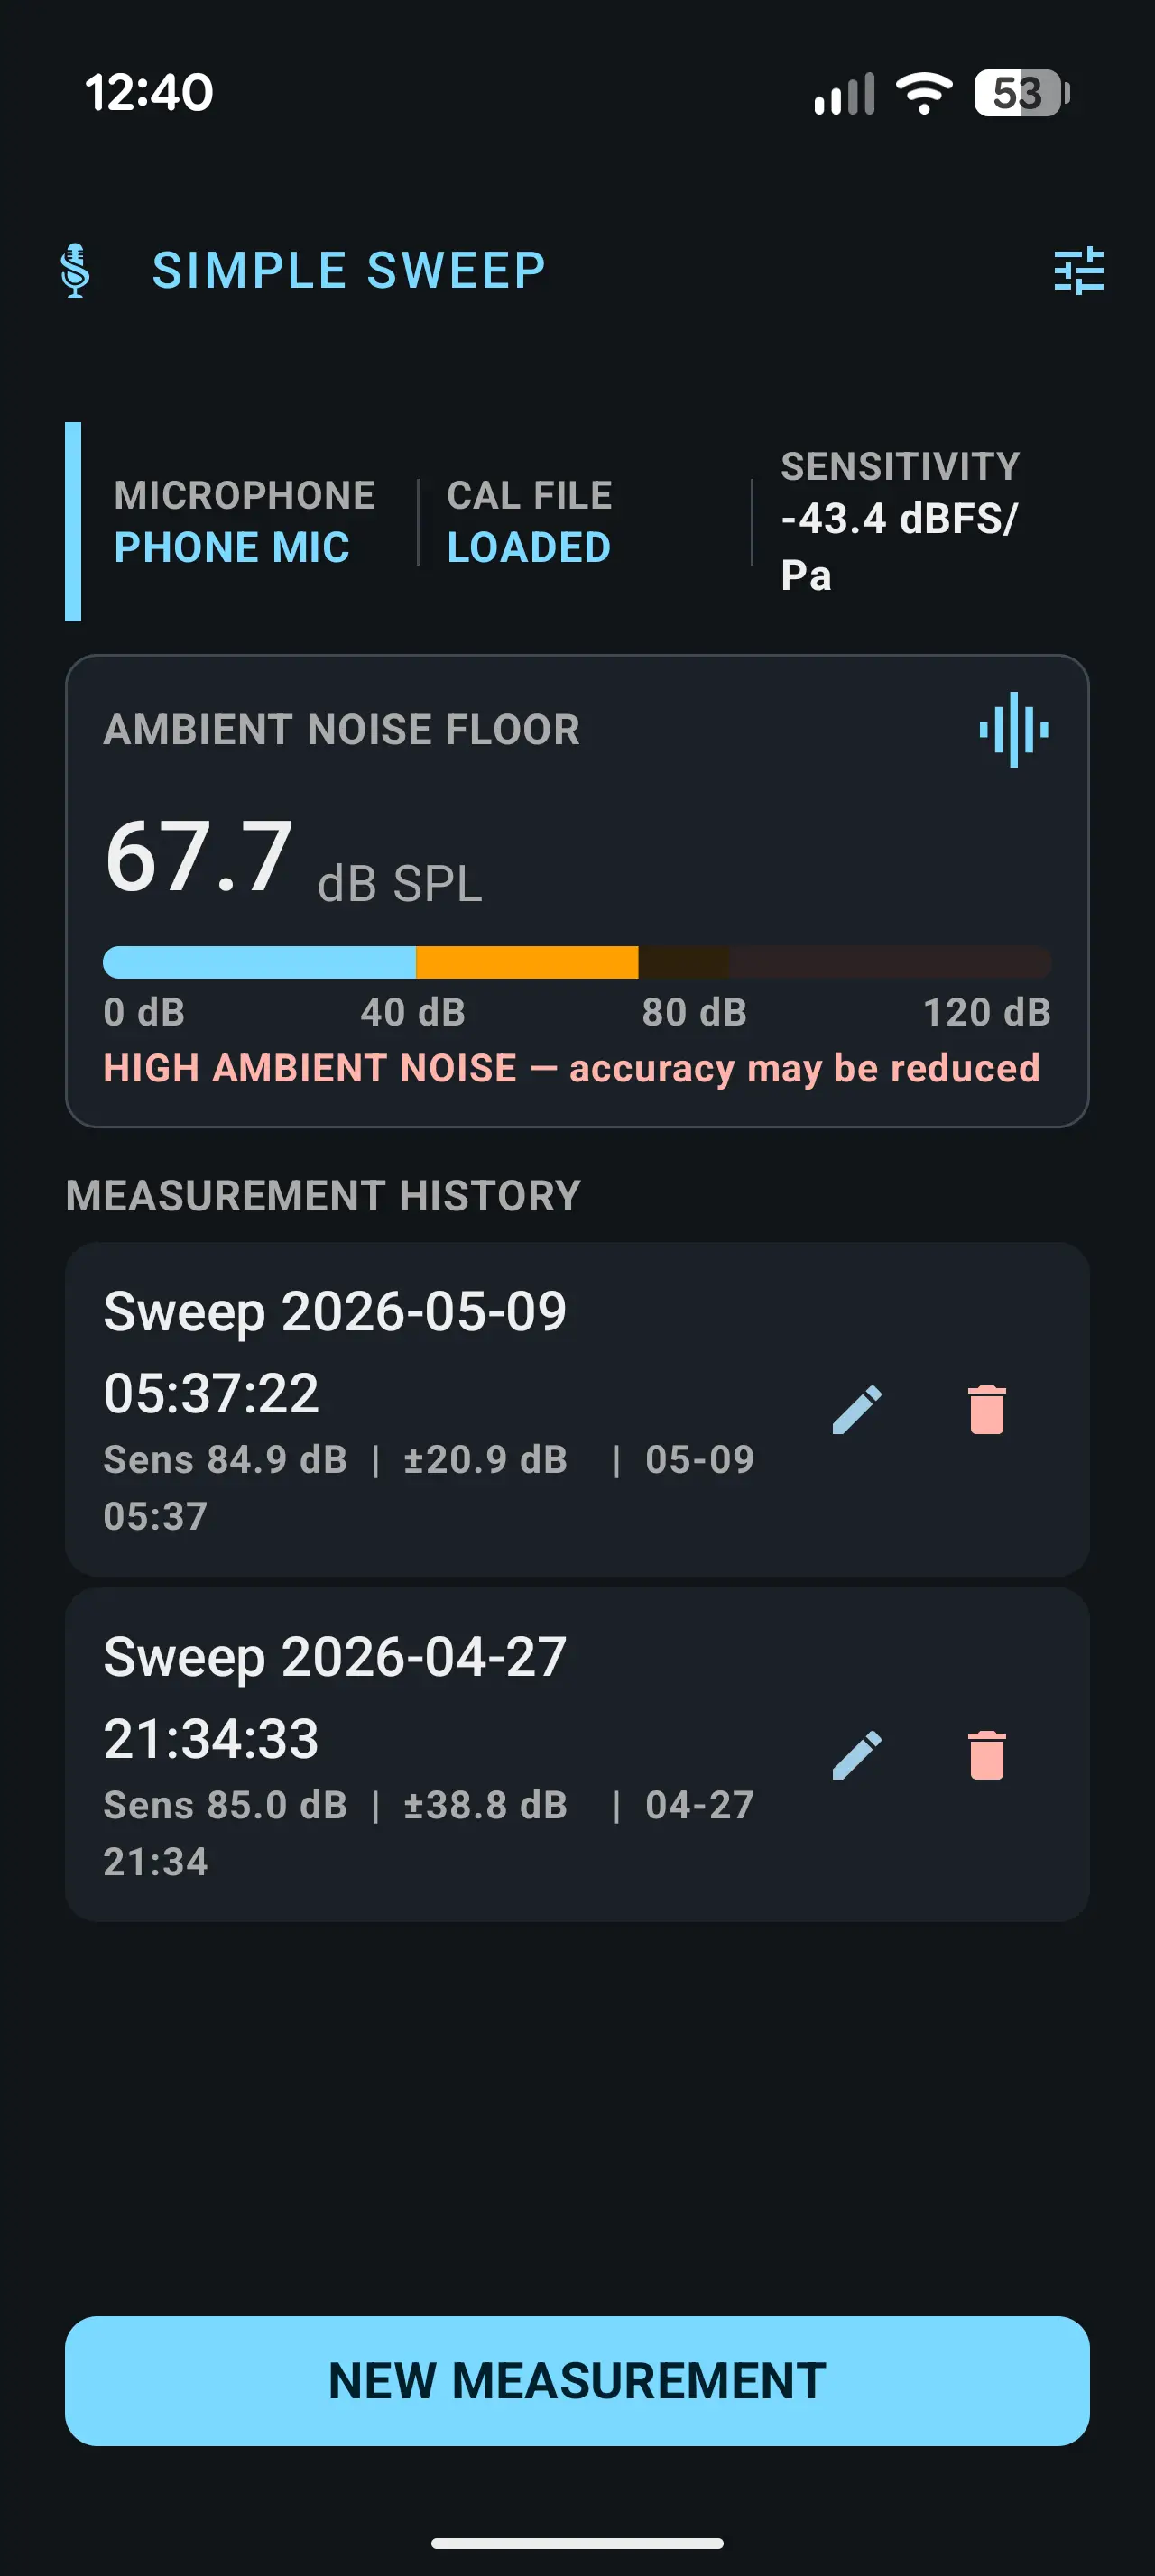
02 / Simple Sweep
One speaker, one sweep, one chart.
The focused workflow: pick a channel, run the sweep, read the curve, export FRD. Four scrollable result tabs — Overview, Distortion, Time & Decay, Phase — so the math is there if you want it and out of the way if you don't.
Frequency response with RAW · 1/12 · 1/6 · 1/3 · 1/1 octave smoothing, per-tap toggle.
Bass extension scanned downward from 500 Hz — speakers that hold target down to 20 Hz read NOT DETECTED rather than a fake number.
Distortion (THD), step response, IR, ETC, waterfall, unwrapped phase + group delay.
L / R / Both output channel selector for measuring individual drivers in a multi-way speaker.
History list, comparison overlay (up to 2 curves), FRD export for REW / VituixCAD / XSim / PCD.
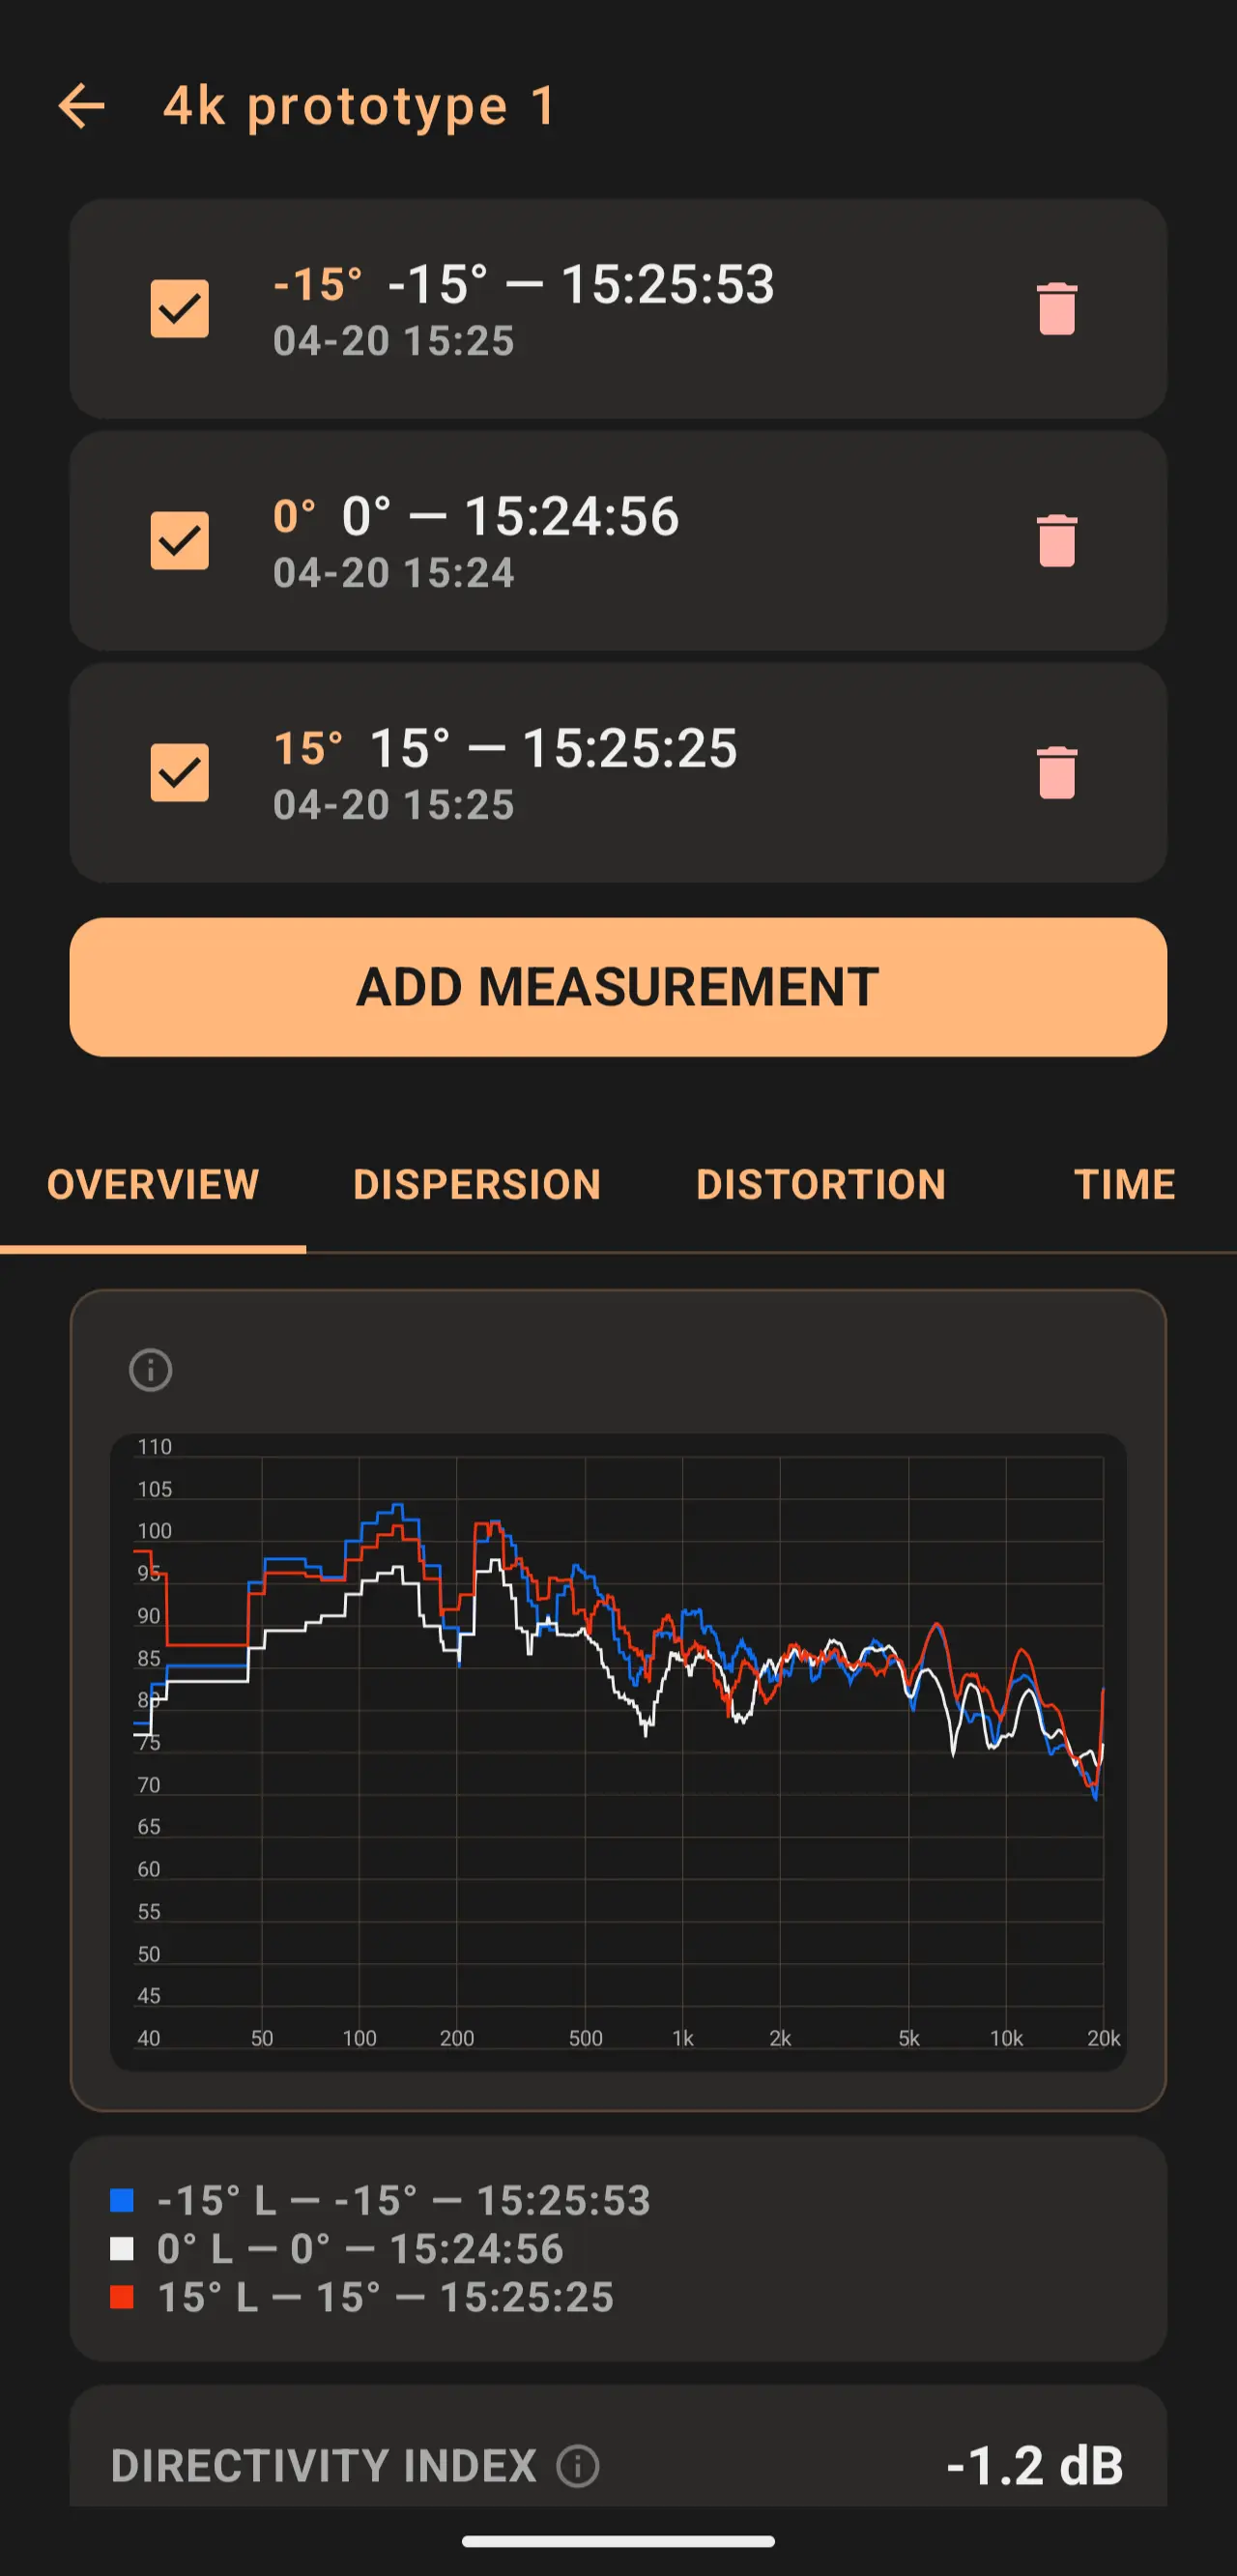
03 / Speaker Lab
Build a directivity profile from a real speaker.
Sweep the same speaker at every angle that matters, store it all under one named profile, and the app builds the dispersion / directivity picture from the stack.
Per-angle measurements with badges (0°, ±15°, ±30°, ±60°, ±90°) all attached to one speaker.
Overlay tabs for SPL, dispersion, distortion, time-domain — toggle each angle on or off.
Directivity index summarises the whole stack as one number — −1.2 dB means the speaker rolls off off-axis.
Same fullscreen + crosshair gesture across SPL, dispersion heatmap, group delay, waterfall — one interaction, every chart.
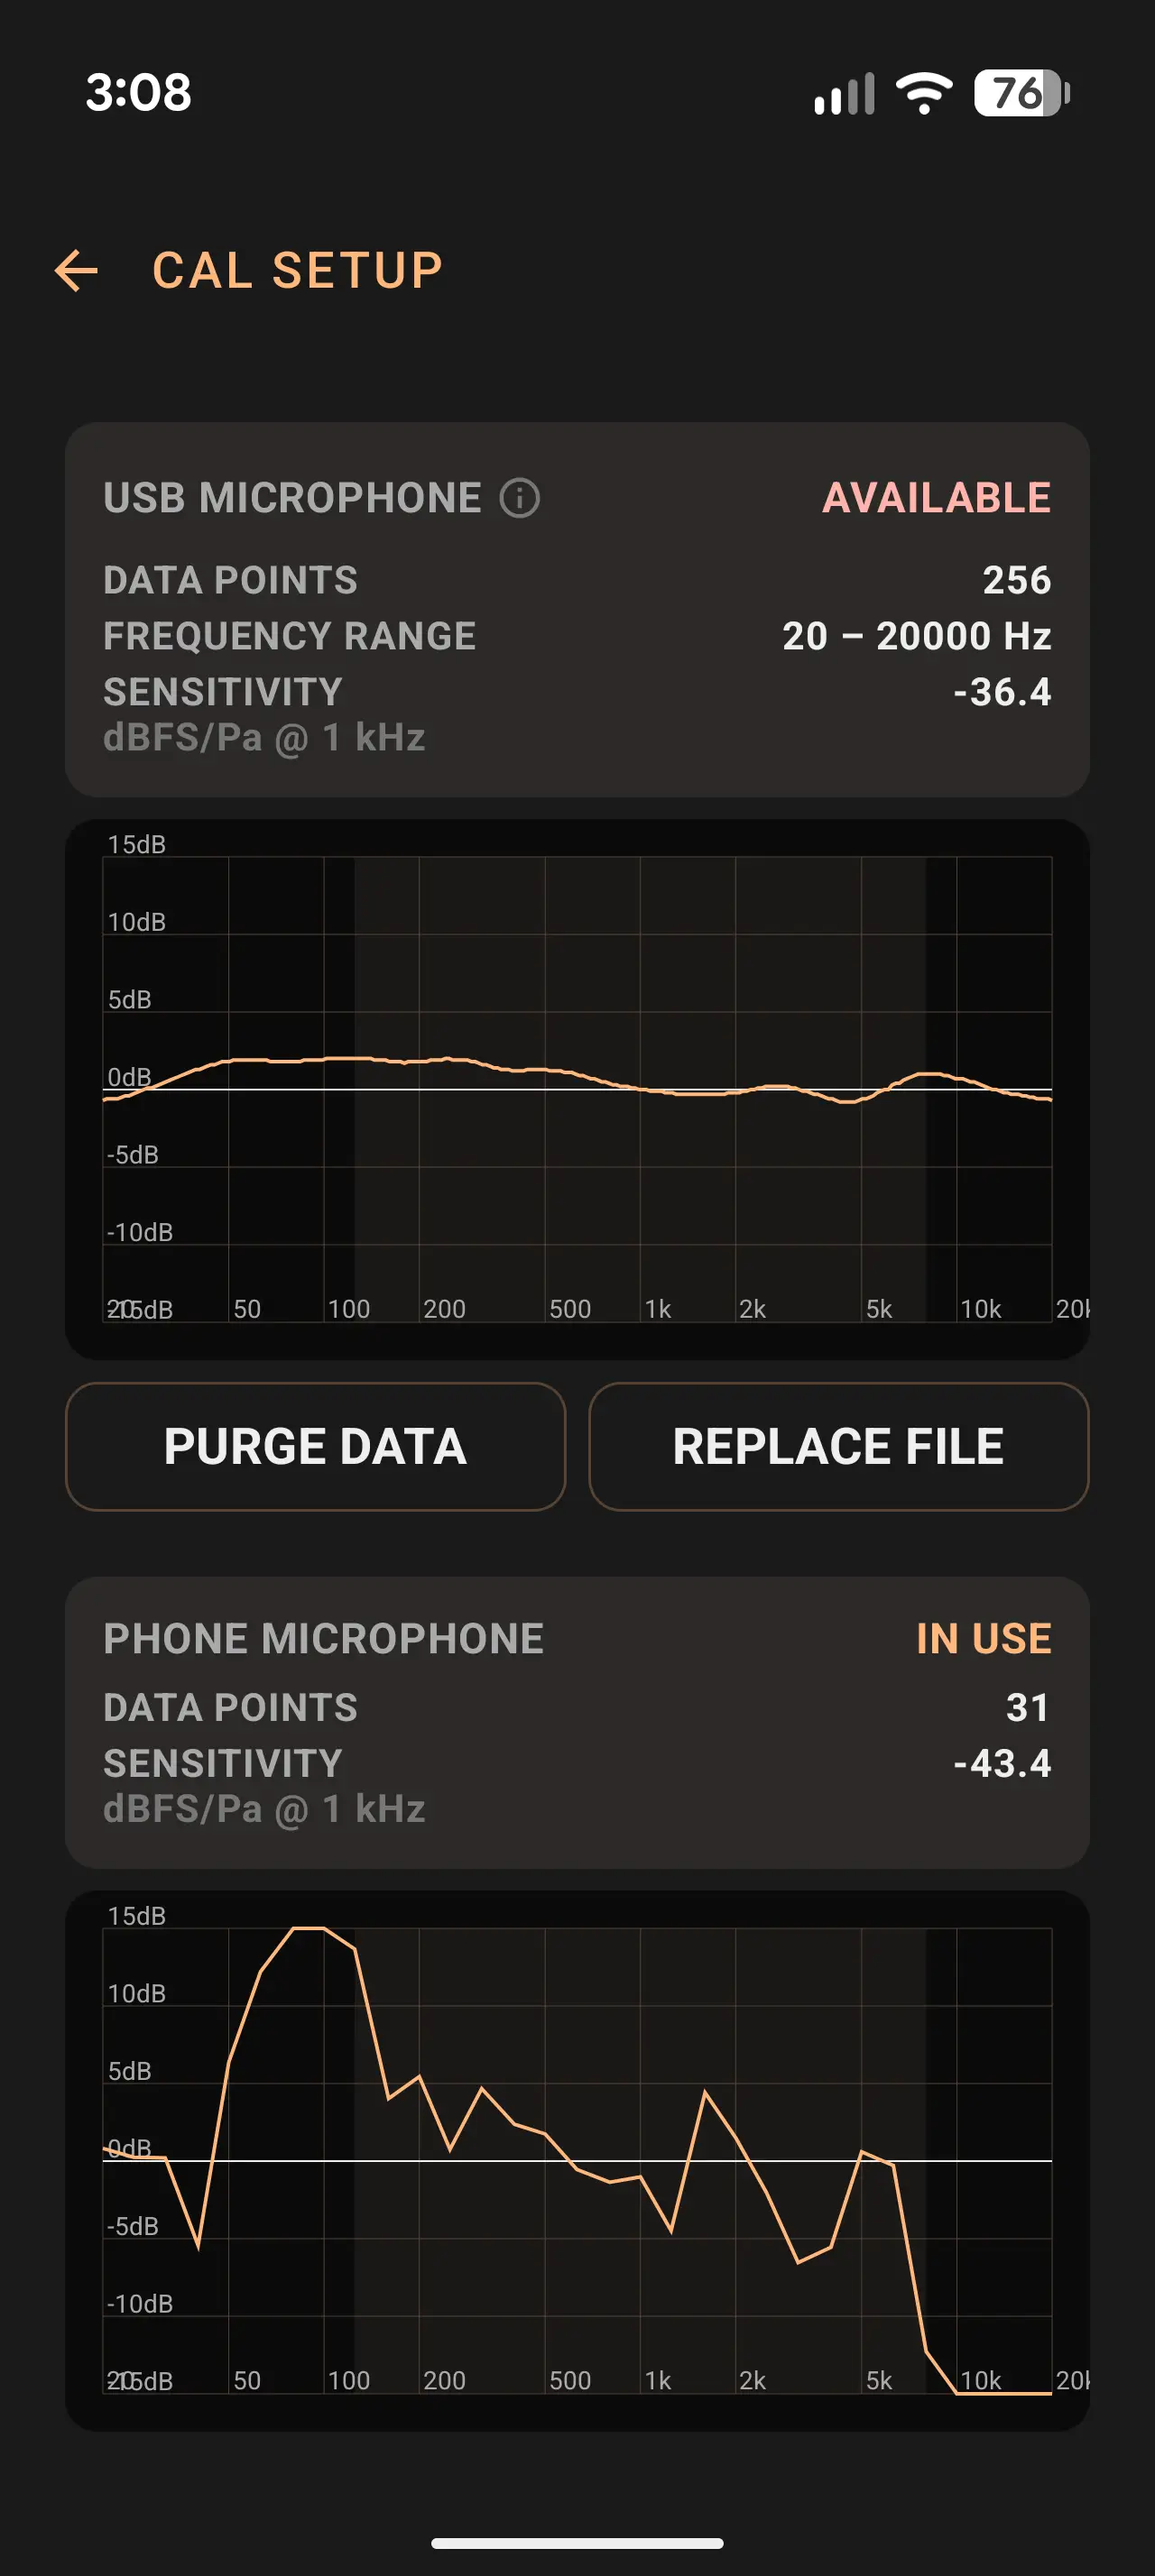
04 / Calibration
Two microphones, one truthful curve.
A USB measurement mic gives absolute accuracy when it's plugged in. The phone-mic wizard generates a per-device correction curve from two back-to-back sweeps against the USB reference — so the phone alone reads the room honestly the rest of the time.
Dual-profile — USB and phone each store their own correction curve plus per-source sensitivity in dBFS/Pa; auto-selects the active source on USB connect / disconnect.
Wizard flow: USB sweep → manual mic handoff → phone sweep → 1/6-octave correction curve at 31 standard 1/3-octave frequencies.
Quality metric is sqrt(smoothness × SNR) × (1 − saturation) — the failing component is named ("smoothness 51%") instead of one opaque score.
Single-channel default — two speakers create an inter-mic comb filter above ~5 kHz that would corrupt the magnitude ratio. The wizard locks the channel before the USB sweep starts.
Phone .cal files are portable — EXPORT writes to Downloads/StainAcoustics/ and re-imports cleanly across Simple Sweep and Stain Acoustics.
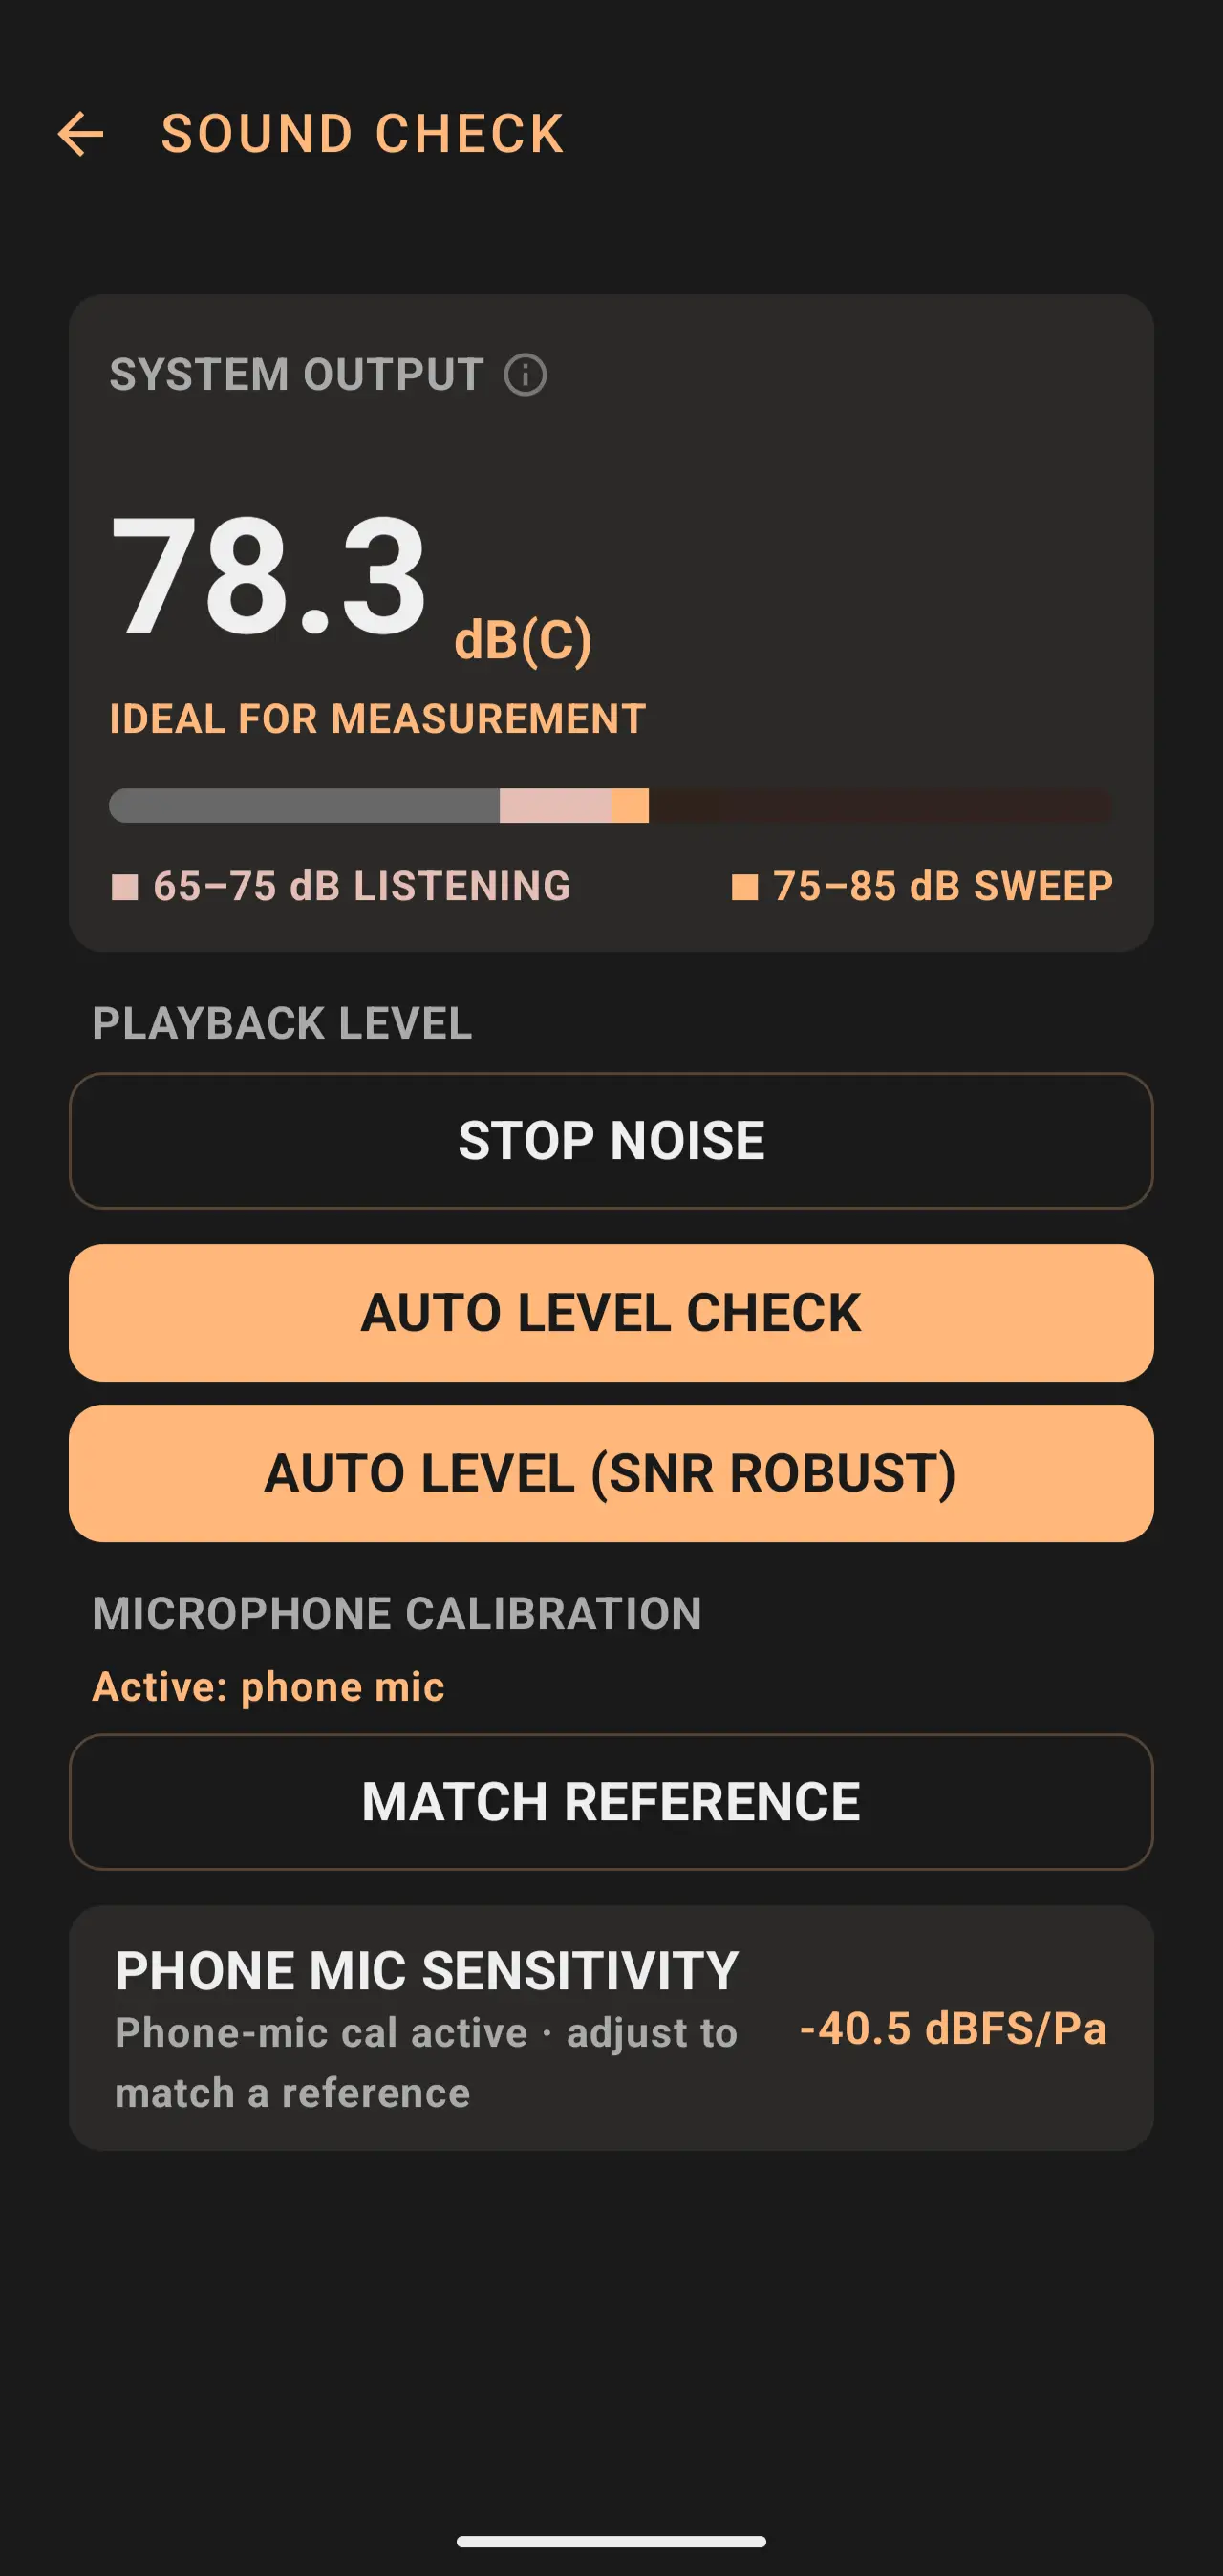
05 / Sound Check
Set the level before you sweep.
White-noise playback with a live SPL meter and two labelled zones — comfortable listening and ideal-for-sweep. Trust the chart only if the level was right when you ran the sweep.
Live dB(C) readout, EMA-smoothed, with the two highlighted zones drawn against the bar: 65–75 dB comfortable, 75–85 dB ideal-for-sweep.
AUTO LEVEL CHECK / AUTO LEVEL (SNR ROBUST) — the app finds the right output gain without you tuning it by ear.
MATCH REFERENCE — enter a known SPL meter reading and the phone's number aligns to the room's truth.
Phone-mic sensitivity override (only when no USB / phone cal is active), ±0.5 dB stepping with a CUSTOM badge so you know you're off the default.
The charts you'll read
Six families of chart, six things they tell you. Drawn here as standalone specimens against the paper-white well the app uses inside its dark cards.
Schroeder decay · RT60 0.49 s
The room's energy decay over time. Dashed lines mark the T20 window used to extrapolate RT60.
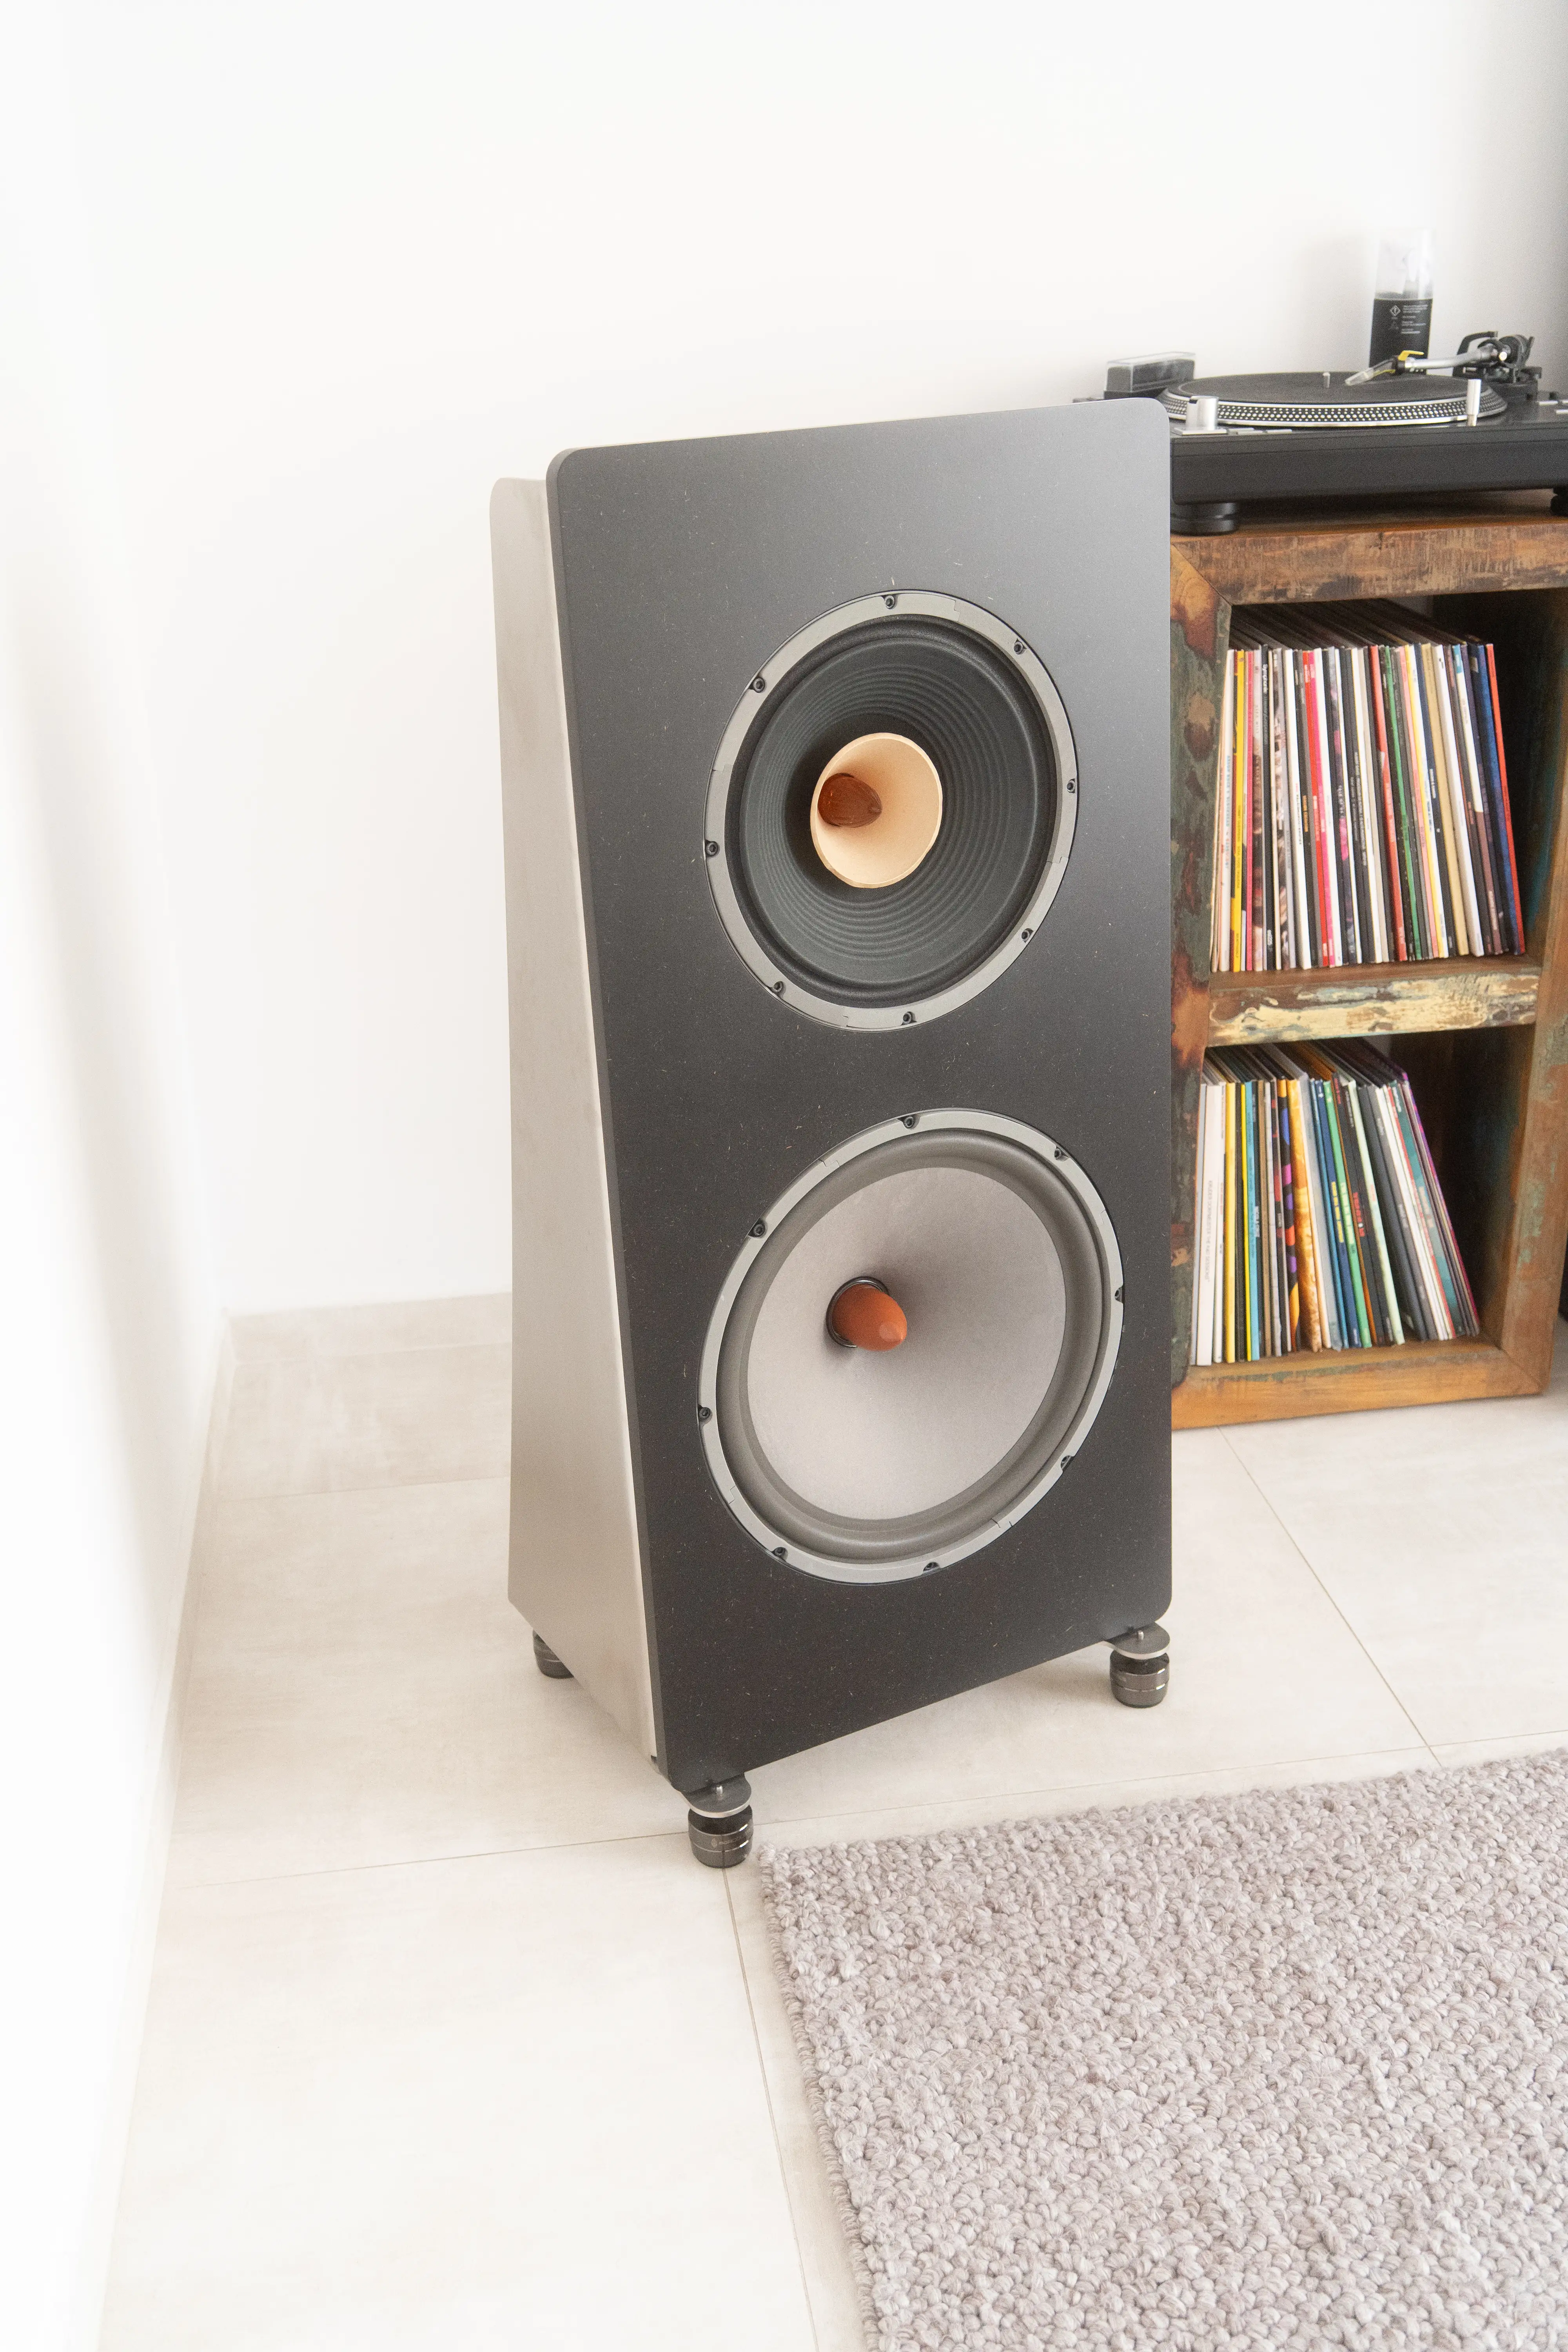
Speaker SPL · 1/6-octave smoothed
EVE SC205, on-axis at 1 m. Flatness ±4.9 dB across 200 Hz – 10 kHz. F3 at 52 Hz.
Phone-mic correction curve
Output of the calibration wizard. dB offset vs frequency, detrended around midband.
Impulse response
Wiener-deconvolved IR. Onset at sync-pulse-aligned t = 0, decay against the IR-space noise floor.
Dispersion heatmap · angle × frequency
Sweep at every angle, SPL on a colour axis. Narrowing band above 4 kHz = beaming.
RT60 spectrum · 1/3 octave
RT60 in 21 1/3-octave bands. Peak at 125 Hz is a room mode; the algorithm refuses to fit slopes it can't see.
FAQ
Six things people ask before they install.
Do I need a USB measurement microphone?
No, but it's recommended for absolute accuracy. The app's phone-mic calibration wizard generates a correction curve from two back-to-back sweeps against a calibrated USB reference, so you get measurement-grade results from the phone alone after a one-time setup. For best results, a Dayton Audio iMM-6C (or any USB measurement mic with a .cal file) plugs in over USB-C.
Does it work on iPhone?
Android only. The audio engine is built on Oboe / Android NDK with USB-Audio routing; an iOS port would be a full rewrite. If you find a measurement app for iPhone that publishes its DSP pipeline as transparently as this one does, please send it — we'd genuinely like to know.
What's the difference between the two apps?
Same DSP core, different scope. Simple Sweep ($5.99) is single-speaker frequency response only — sweep, see the chart, export FRD. Stain Acoustics ($10.99) is the full suite: rooms, multi-angle speaker profiling with dispersion heatmaps, the phone-mic calibration wizard, and Simple Sweep itself as a module inside.
What microphone do you recommend?
A Dayton Audio iMM-6C is the easiest path on a USB-C phone — ships with a per-unit .cal file, no external interface needed. Any USB measurement mic with a standard .cal file (UMIK-1, miniDSP UMIK-2 via USB-C adapter) will also work.
Can I export to REW / VituixCAD / XSim?
Yes. Speaker measurements export as .frd (frequency / magnitude / phase) compatible with REW, VituixCAD, XSim, PCD and Speakerbench. Room measurements export as 24-bit mono .wav (the calibrated impulse response) plus a JSON metrics sidecar. All files land in Downloads/StainAcoustics/ on Android 10+.
Does it work with Bluetooth speakers?
You can run a measurement over Bluetooth, but the app will tell you it's a bad idea. Codec compression cuts treble above ~14 kHz and variable latency smears the impulse response. The Bluetooth-output detection card lights up on every measurement-setup screen, recommending a 3.5 mm or USB DAC connection instead.